Dashboard
A centralized overview of your organization's feedback activity, annotation trends, and connected services.
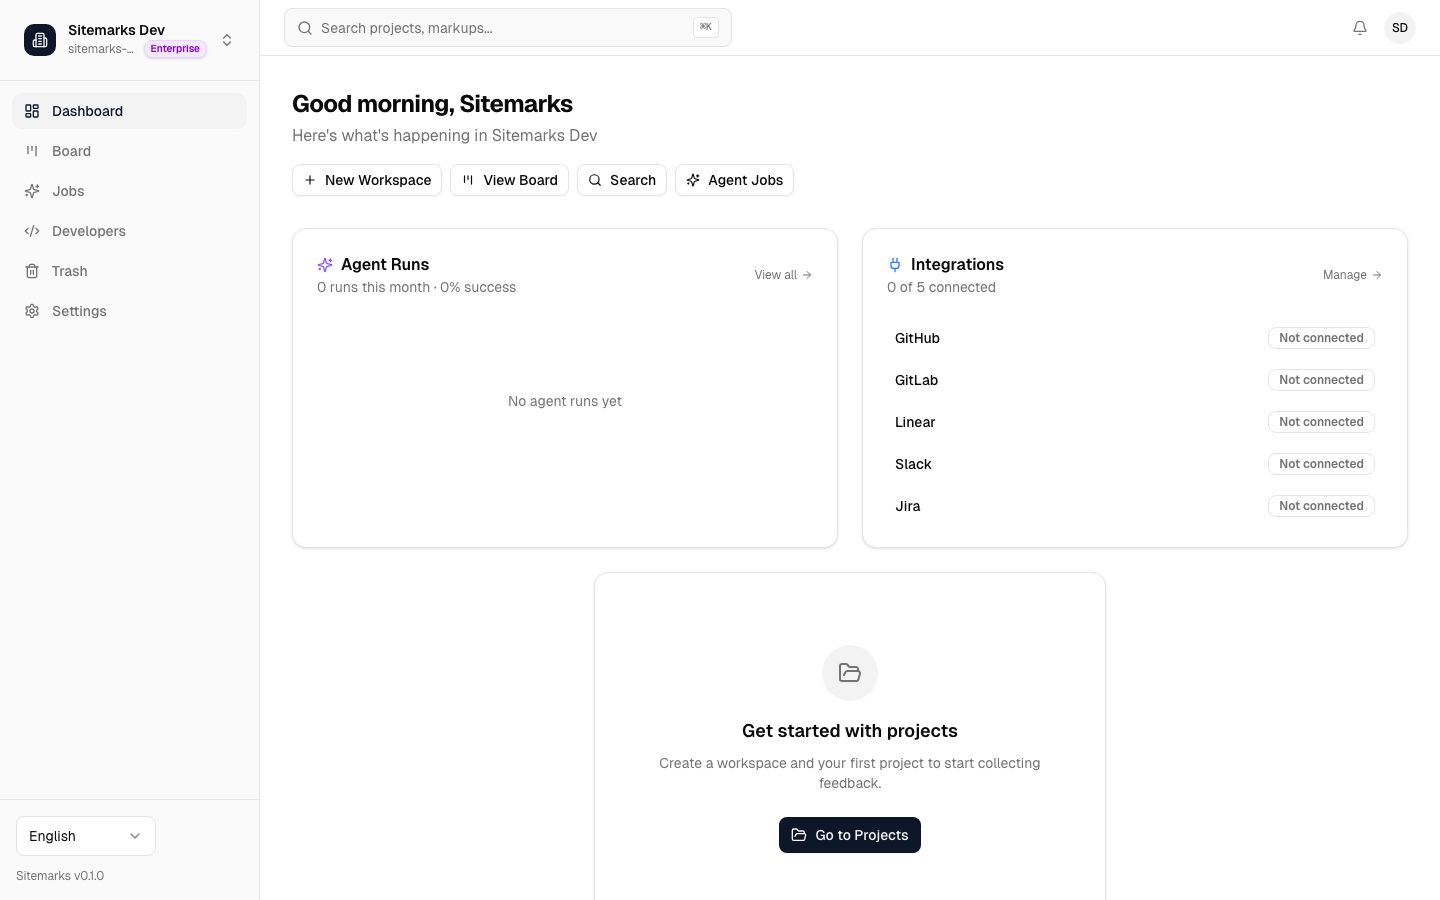
The Dashboard is the first screen you see after signing in. It aggregates key metrics from across your organization into a single view, giving you an at-a-glance summary of feedback activity, annotation health, agent usage, and integration status.
Personalized Greeting
The top of the page greets you by first name along with a time-of-day message (good morning, good afternoon, or good evening). Beneath the greeting, you will see the name of your currently active organization, so you always know which workspace context you are operating in.
Quick Actions
A row of shortcut buttons appears directly below the greeting. These let you jump to common tasks without navigating through the sidebar:
- New Workspace — opens the Projects page where you can create a workspace.
- View Board — navigates to the Kanban-style board view for triaging annotations.
- Search — opens the global search page to find markups, annotations, or comments across the organization.
- Agent Jobs — takes you to the agent jobs page to monitor AI-powered runs.
Stats Cards
Six summary cards span the top of the analytics section. Each card displays a primary metric and a supporting subtitle:
- Open Feedback — the number of unresolved annotations, with a breakdown of how many are "in progress" versus "in review."
- Resolution Rate — the percentage of annotations that have been resolved, shown alongside the raw resolved-over-total count.
- Total Annotations — the cumulative annotation count across all projects, with the open count repeated for quick reference.
- Recent Comments — comment volume over the last 7 days, so you can gauge how actively your team is collaborating.
- Agent Runs — the number of AI agent executions this month, useful for tracking automation usage.
- Integrations — the count of active integration connections (GitHub, Slack, Linear, and others).
Annotation Trend Chart
A line chart plots annotation creation over time, typically spanning the last 14 or 30 days. Use this to spot spikes in feedback volume — for example, after a new release — and to confirm that your team is keeping up with incoming items.
Status Distribution
Beside the trend chart, a breakdown shows how annotations are distributed across statuses (open, in progress, in review, resolved) and severity levels. This helps identify bottlenecks: if a large share of annotations stay "in progress" for too long, you may need to reassign work or adjust priorities.
Agent Runs Summary
A dedicated card summarizes your organization's AI agent activity. It shows recent runs, their outcomes (completed, failed, or in-progress), and a quick link to the full agent jobs page. If your organization uses the agentic development workflow, this card keeps you informed about automated fixes and code generation tasks without leaving the Dashboard.
Integration Status
The Integration Status card lists each connected service and whether it is currently active. At a glance, you can confirm that your GitHub, Slack, or Linear integrations are healthy. If a connection has gone stale or been revoked, it will be flagged here so you can re-authenticate before it affects your workflow.
Active Projects and Activity Feed
The bottom row contains three panels:
- Site Imports — a summary of any in-progress or recently completed site import jobs, including page counts.
- Active Projects — a ranked list of projects ordered by recent activity, so you can jump directly to the ones that need attention.
- Activity Feed — a chronological stream of the latest actions across your organization: new annotations, status changes, comments, and more.
Empty and No-Organization States
If you have not yet selected an organization, the Dashboard prompts you to create or join one. If your organization exists but has no projects, you will see the Agent Runs and Integration Status cards alongside a call-to-action button that links to the Projects page, guiding you through the first step of setting up your feedback workflow.
Keyboard shortcut
Use the sidebar or the Quick Actions bar to navigate. The Dashboard is designed to be a launching pad — spend a few seconds scanning metrics, then dive into the area that needs your attention.